Pages

Friday, May 29, 2009

Hom-asse-ferentiation

All the new schools come with cafegymatoriums so I figure I'll go with a 3-in-1 post.

Homework


 For 12 years I had assigned it but it always bugged me that we would spend 15+ minutes the next day going over something that many of the students didn't complete.  And if they did bring it in, how did I know if it was actually their work?  Now that I have children of my own in school, I am even more bothered by the amount of busywork that imposes itself on family time.   

My question isn't regarding the validity of homework.  My question revolves around the idea of how to make homework matter.  How do we make it meaningful to our students?  Can we tie it to assessment and/or differentiate it so that kids can work on what they need at any given point in time? And further, can homework become part of a meaningful dialogue between teacher and student rather than a box to be checked on the daily "to do" list? 

Assessment


Quiz, Quiz, Test.  Quiz, Quiz, Test. Quiz, Quiz, Test. 

Isn't that how the pattern goes?  Followed that one too.  But again, over the past few years, my view of assessment has changed.  When do we assess?  How often?  How many times should a student have to show us he can do something?   How many different ways should he have to show it? Multiple choice or free response?  Where does writing come into play? 

For the past three years, we have been dealing with pacing guides and benchmarks due to the fact that my district is in program improvement.  I am in favor of it.  Pacing guides and benchmarks  have allowed us to begin with the end in mind, check for understanding along the way and then find ways to intervene with students who are struggling to grasp the concepts/skills.  However, I have noticed that teachers have a tendency to become very procedure oriented and lose sight of all the great thinking that can be provoked in a math classroom.  I don't blame this on pacing and benchmarks any more than I blame bad lessons on the tools being used in the classroom.  It has become obvious that the textbook pacing isn't the way we want to go, so we have started to teach one standard at a time.  But I think that many of our standards need to be deconstructed even more in order to ensure that when we assess, we get a grip on where a student is really struggling.  For example, in California, Algebra Standard 15.0 deals with mixture, rate and work problems.  It isn't enough to say that a kid is struggling with 15.0, we need to be a bit more specific in order to fix the problem.  I know that Dan has done a nice job of explaining the need to break the curriculum down into skills and he has a great assessment plan.  The part we have struggled with is what to do in between the initial assessment and the re-assessment(s).  Which leads us to...

Differentiation


Is it enough to throw some review problems up on the board for warmups and call it "intervention?"  Do we give students different assignments based on their need -- and when we give  these assignments, how do we grade them?  How much weight do they carry in relation to the final grade? Can I actually have 30 kids working on 30 different things?  If so, does that mean that I have to come up with 30 different assignments for each skill I want to remediate?  My head hurts just thinking about it. 

Until recently. 

Why can't we tie them all together? Why can't homework/classwork be prescribed based on the results of an initial assessment becomming a prerequesite for the re-assessment; a key to unlock the assessment box.  A student can be placed into one of two paths: the road to proficiency or the road to advanced status. Once a student reaches proficiency in a certain standard/skill, he earns a B.  He then has the choice to move towards advanced status in that skill (for an A) or work towards proficiency in another skill. If he never moves onto the advanced path, the score for that skill remains a B.  I am not sure if we should go with a 1-5 grading system or attach a percentage to the rubric score. (ie. 5 = 90%, 4 = 85%, 3 = 75%, 2 = 65%, 1 = 50%)

  Over the past month, I have had some release days and have come up with a template.  The challenging part has been to decide which "tasks" a student must complete before being allowed to re-assess.  These tasks are very minimal in that they merely show what I would like a student be able to show before he is allowed to re-assess.  Could a student take these tasks and "create" their own problems based on the template, or would the teacher need to be more hands on in helping direct the student?  Are there skills I am missing?  Are there ways to demonstrate the skill that I am leaving out?  How can this be adapted for student interest and/or modality?  And most importantly: does this idea stand a chance? I would really appreciate any feedback that I can get on this.

Note: Our math classes are in 94 minute daily blocks, so time for intervention/enrichment is built in.  We will go with a sort of 60-30 model next year where we do regular instruction for the first 60 minutes and leave the last 30 minutes for students to work on their choice of previous skills. 

The proficiency tasks for each skill will be followed by the student doing an exemplar.  My working definition of "exemplar" is a problem that exemplifies the given skill worked by the student with written and/or verbal explanation of the process used.  I have found these to be very good authentic assessments.  The student has the option to do this via paper and pencil or mathcast.

Friday, May 22, 2009

Huh?

Brain teasers for dummies


Wonder what those puzzles look like...

Tuesday, May 19, 2009

For All the Marbles...

Final Exam


Final exam. One question.

How Tall Is It?

"Show me two different ways  you could figure the height of the building."


"That's easy, Mr. Cox. Measure a brick and count the number of rows."


"Alright, make it three, smart guy."


Friday, May 15, 2009

Are Two Ways Better Than One?

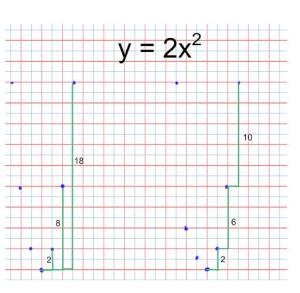
Graphing parabolas is much easier when we can zero in on "key points."  The CPM Algebra 2 curriculum was great about dealing with "parent graphs" and then showing students the process for translating and stretching these parents.  It is easy to get away from this as we have other skills that we need to teach.  But this year, I have really focused on having my students get really comfortable with y = x2 and then recognizing that all parabolas are really just different perspectives of this parent graph.  Zoom out and the parabola get skinnier; zoom in and it gets fatter.  If you know the vertex and stretch factor, then you are ready to do some graphing;  this works for vertex or standard form.

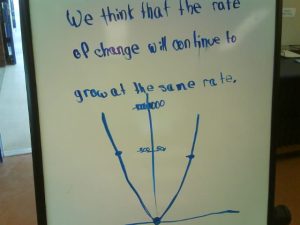
One of the more interesting developments during this unit has been my students recognizing that the rate of change in a parabola has a rate of change.  They are wrestling with the concepts behind derivatives and I want to keep them in that fight as long as possible.  I usually have my students graph five points and I have always had them relate those five points back to the vertex.  However, with the way they are handling rate of change, I need to rethink my process. 

a=1Simply use the stretch factor to adjust the relationships:a=2 This year I have given them choice on this, but it has caused a few kids confusion as they end up with a hybrid process.  Next year? Not so sure.
Thursday, May 14, 2009

Ya Think?

Teacher: "What do you think about...?"

Student: "I don't know."  Translation: What do you want me to think?

A recent post by Jason Dyer  regarding the findings of Piaget being re- interpreted by James McGarrigle and Margaret Donaldson has me thinking about how often I give off context clues without even thinking about it. 

*nodding head, smiling* "Do you understand now?"

*raising hand* "Raise your hand if you get it."

*squinting with furrowed brow, head cocked to the side* "Can you explain how you got that answer?"

And more importantly, how I perpetuate the very thing that I beleive is wrong with education.

They cue in fast...really fast.  Mine cue in faster than others 'cause I got the smart ones.  But you know what, they don't think better than the others, they just figure out what the teacher wants to hear faster and at a higher accuracy rate.  They play "school" better. The ones who are the real thinkers are the smart kids we call lazy.  Yeah, that one-- the kid who doesn't turn stuff in or do homework but crushes every test.

I am starting to think it's not his fault. Maybe, just maybe, he's just not interested in me giving him answers to questions he doesn't care to ask.

Tuesday, May 12, 2009

Stretch Factor

What does a normal parabola look like again?

stretch factor =1

And what about one with a stretch factor of 7?

stretch factor greater than 1

And how about 1/10?

stretch factor less than 1

Nice job folks. 

Now get out some paper and get to work! 

And quit smiling...math ain't that fun.

Monday, May 11, 2009

Chandler Saves the Day

You ever have a lesson that you thought was going to go pretty well only to have it fall flat?  Yeah, that happened today. 

My 7th graders have been going over quadratics for the past couple of weeks.  I have been out quite a bit on school business, so the progress has been slow, but very rewarding.  Last week, students discovered that if you change the value of "a", it has an effect on how fast the parabola grows.  I then had them graph a bunch of parabolas whose line of symmetry was the y-axis only to have a student ask,

"Can we move the parabola left or right?"

"Well since you asked..."  So I did what any responsible teacher would...I had them graph a bunch of parabolas whose vertex sat on the x-axis which led to the next question,

"Can we move them up/down and left/right?"

So Friday, we are graphing parabolas in the form y =a(x-h)^2 +k and they are getting it.  This is stuff I couldn't do until Algebra II with my high school students and these 7th graders are just crushing everything I throw at them. I would even give them a vertex and  a second point and they were giving me an equation because they figured the stretch factor using the second point.  Things are looking good and I am thinking:

Man this is just toooo easy...

Yeah, I know, pride comes before the fall.  Which is what started to happen today.  I have had a planning block.  Now that we have graphed a bunch of parabolas in vertex form, where do I go from there?  Do I start dealing with standard form? Do I show them how to expand (x-h)^2 in order to arrive at standard form?  I am still not sure what the ideal path would be.  But being the "try anything once" kind of guy I am, I figured that since I have already had them:

  • Graph quadratics organically (area vs. radius; area vs. side length)

  • Graph quadratics with a not equal to 1.

  • Graph quadratics with vertex on y axis.

  • Graph quadratics with vertex on x axis.

  • Graph quadratics in the form y = a(x-h)^2 +k


...then I would focus in on what was necessary to graph a parabola:  vertex and stretch factor.  If they could identify the vertex and a stretch factor, they can graph anything, right?  So today I wanted them to graph a bunch of parabolas in standard form, look for the line of symmetry and recognize the relationship between a,b and the line of symmetry.  I didn't expect them to necessarily "discover" that the line of symmetry is x = -b/(2a), but I figured that if we graphed enough of them, we might start to notice some patterns.  Once we have the line of symmetry down, then we could start looking at x intercepts which would lead us to factoring and completing the square as well as quadratic formula.  (If my sequencing on this is bad, please save me from myself. )

This is where it started to go bad.  GeoGebra is a great program, but it doesn't save a weak lesson.  Kids were all over the place with their parabolas and we were getting lines of symmetry like x=.7923496, which wasn't going to help at all.  I was about to put us all out of our misery and jump ship when Chandler says, "Mr. Cox come here, I think I found something." 

She had about 10 parabolas that all had the same line of symmetry.  She was making adjustments to the a and b values and recognized that the c value had no effect on the symmetry. So rather than aborting the mission, we just changed course. 

"How about choosing a line of symmetry and keeping the vertex on that line?"

They got right to it.  Tomorrow they are going to come to class with five different a,b,c values and the corresponding line of symmetry.  We will see where it goes. 

Note to the reader:  Quadratics are not a 7th grade standard and these kids will go through it on a deeper level as 8th graders.  So, I am not worried about "finishing" this with them.  I have the flexibility to let concepts marinade for a while.  Usually, I would have just followed the pacing of the book, but I have become very dissatisfied with that.  I am pretty sure that I want to continue from linear relations right into quadratic relations and that graphing is a good gateway to all the other skills that go along with quadratics.  I am just not sure how one skill will best lead into another.  Any suggestions?

Note to self: Quit gettin' ahead of yourself and be sure to see the lesson through the eyes of a student rather than your own. 

Oh yeah, and thank Chandler.

Monday, May 4, 2009

Upgraded to Pandemic

At least in my own head. No, I can't shut it off! Not sure I would want to even if I could.

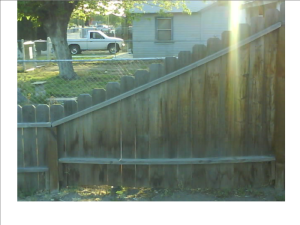
I am getting gas the other day and this shot is screaming at me:

linear-relationships-1_1


So today, I put the slide up and the kids immediately start talking about slope.  I like that they thought slope, but slope isn't really going to do much when it comes to fences. So I asked them:

"What would you want to know if you had to build the fence?"

They caught on pretty quickly that one would want to know the length of each board. 

"Alright, then tell me the length of each board."

"But, Mr. Cox, we don't have enough information."

"What do you want to know?"

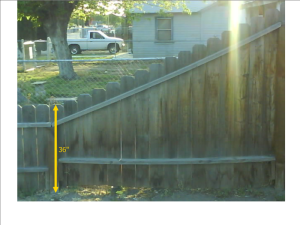
"We need to know how long the shortest board is."

Done.

linear-relationships-1_3

"Alright, now tell me how long each board is."

"We can't. We need more information."

So I had them discuss with their groups what information they had to have in order to figure out how long each board was.  Once they had an exhaustive list, they were to write it on their group's easel.  We quickly came up with the following:

  • The length of the next board.

  • The length of one more board.

  • The width of each board.


So do we need the next board, or will any board do?  We eventually settled on any other board.

It didn't take long before students had listed all the board lengths.  Many used the rate of change and then added the increase to each board to find the length of the next.  But it did't take much prodding for them to realize that having an equation would be nice.  We came up with y = 2.5x + 36 fairly quickly.  The interesting discussion came about when I asked what x represented.

"X is the number of boards."

"Okay, so go up to the board and point to board #1."

Which board do you think they pointed to? (You guessed it, the one labeled 36". )

"So, plug 1 into your equation and check it out.  Tell me if your equation works."

You would have thought that I asked them to stand in the corner of a round room. But once the "but this equation haa-aas to work" wore off.  They realized that it wasn't the equation's fault.  It was how they defined x.  Board 0 is important because we aren't actually counting boards, we are counting the number of increases. 

Reflection: I think that the lesson went really well, but it was very telling how many students wanted to impress with their knowledge of the vocabulary as opposed to just looking at the problem and asking the obvious questions.  They were trying to be mathematicians rather than someone who just needs to build a fence.  Next year I want to do a better job of introducing concepts a bit more organically as opposed to "here are the rules, here are some examples, let's get to it." Students are much more engaged when the information is given a little at a time.  It keeps them from answer chasing and allows them to think a little.  It may take a bit longer to deliver the lesson, but the benefit of having kids think about the math is priceless.  

Questions: What else could I have done with this image? 


Friday, May 1, 2009

Intro to Quadratics: 7th Grade Style

Can I just say that I love middle school kids.  I mean, sometimes keeping them on the same page is like trying to herd a bunch of cats, but I love them.  Now that testing is over, it is time to start preparing my 7th graders for the wonderful world of quadratics.  We have been doing a bunch of activities on linear relationships and the results have been pretty good.  My kids have a pretty firm grasp of the following:

  • Slope and rate of change mean the same thing.

  • If the rate of change remains the same, then we have a line.

  • The initial condition is the y intercept.

  • If the initial condition is 0, then we have a direct variation.


They like lines; they are comfortable with lines.  It is time to take them out of their comfort zone.  So here is how it went down:

We had already done some activities on linear relationships like:

  • Farenheit vs. Celcius

  • cm vs. inches

  • km vs. miles

  • start height vs. rebound height for a bouncing ball on concrete between 75 and 80 degrees with no wind resistance. (Alright, we didn't control the experiment that much, but they still saw that the ball rebounded to about 70% the original height.  Daniel learned that baseballs don't bounce very high when you drop them from 1 meter and the seams mess up the bounce.)


The latest installment was to have them bring in a few circular items and then find the relationship between radius vs. circumference.  This led quite nicely into, 'Well, since you have some circles here, you may as well calculate the areas too.  Graph those compared to the radius and see what you get."

It was interesting to see how many kids tried to force it into a linear relationship. 

Angel recognized that "choosing a bunch of circles with around the same radius doesn't tell us much, huh, Mr. Cox." 

"Nope, next time we may want to expand our sample space."

Regardless, by the end of the activity, they understood that sometimes we have relationships that are "curved" or "non-linear."  Fareen recognized that we get a "half of a parabola." 

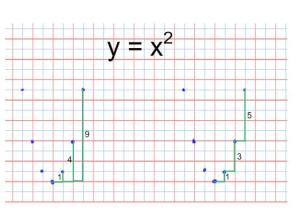
So from there we do some work with the side length vs. area of a square.  Hey, we may as well start at the beginning, right?  But it was the simplicity of the exercise that produced the magic that I never saw in 10 years of teaching high school kids the same thing. 

"Hey, Mr. Cox, it isn't a line because the slopes don't stay the same."

"Yeah, so what?"

"Well the areas increase by 3, then 5 then 7.  But the increases all increase by 2."

"Okay, so what does that mean?"

"The rate of change has a rate of change."

5109-intro-to-quads


At this point I get goosebumps.

This is when Abel, asks: "What will happen if we cube x?  What happens to the rate of change then?"

Couldn't pass this one up, so we drew up a chart and did it.  The kids concluded that for a cubic: the rate of change of the rate of change has a rate of change. Oh, and the number of times we have to check the rate of change tells us what the exponent is.

5109-intro-to-quads-2


Moral of the story: Don't assume that your lesson objective is the right one.

or, Sometimes it is better to follow the herd of cats.